www.michael-buhlmann.de
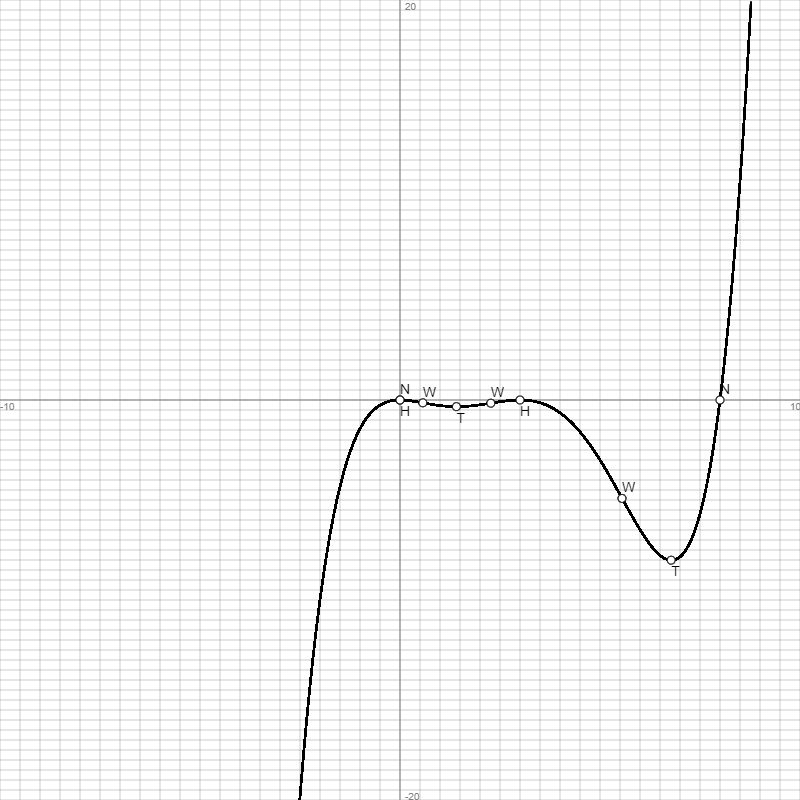
Funktion: f(x) = (x2-3x)2(x-8)/100, Df = R, Wf = R, Polynom 5. Grades, x -> -∞: f(x) -> -∞, x -> +∞: f(x) -> +∞ ->
| Wertetabelle: | |||||
| x | f(x) | f'(x) | f''(x) | f'''(x) | Besondere Kurvenpunkte |
| -10 | -3042 | 1245.4 | -403.64 | 97 | |
| -9.5 | -2467.7734 | 1055.39 | -357.03 | 89.48 | |
| -9 | -1982.88 | 887.76 | -314.1 | 82.25 | |
| -8.5 | -1576.5853 | 740.7 | -274.72 | 75.32 | |
| -8 | -1239.04 | 612.48 | -238.72 | 68.69 | |
| -7.5 | -961.2422 | 501.44 | -205.97 | 62.36 | |
| -7 | -735 | 406 | -176.3 | 56.33 | |
| -6.5 | -552.8941 | 324.65 | -149.58 | 50.6 | |
| -6 | -408.24 | 255.96 | -125.64 | 45.17 | |
| -5.5 | -295.0509 | 198.57 | -104.35 | 40.04 | |
| -5 | -208 | 151.2 | -85.54 | 35.21 | |
| -4.5 | -142.3828 | 112.64 | -69.08 | 30.68 | |
| -4 | -94.08 | 81.76 | -54.8 | 26.45 | |
| -3.5 | -59.5197 | 57.5 | -42.57 | 22.52 | |
| -3 | -35.64 | 38.88 | -32.22 | 18.89 | |
| -2.5 | -19.8516 | 24.99 | -23.62 | 15.56 | |
| -2 | -10 | 15 | -16.6 | 12.53 | |
| -1.5 | -4.3284 | 8.15 | -11.03 | 9.8 | |
| -1 | -1.44 | 3.76 | -6.74 | 7.38 | |
| -0.5 | -0.2603 | 1.22 | -3.6 | 5.25 | |
| 0 | 0 | 0 | -1.44 | 3.42 | Nullstelle N(0|0) = Schnittpunkt Sy(0|0) = Hochpunkt H(0|0) |
| 0.5 | -0.1172 | -0.36 | -0.13 | 1.89 | |
| 0.568 | -0.1418 | -0.36 | 0 | 1.7 | Wendepunkt W(0.57|-0.14) |
| 1 | -0.28 | -0.24 | 0.5 | 0.66 | |
| 1.414 | -0.3312 | 0 | 0.6 | -0.13 | Tiefpunkt T(1.41|-0.33) |
| 1.5 | -0.3291 | 0.05 | 0.58 | -0.27 | |
| 2 | -0.24 | 0.28 | 0.28 | -0.9 | |
| 2.274 | -0.1561 | 0.32 | 0 | -1.12 | Wendepunkt W(2.27|-0.16) |
| 2.5 | -0.0859 | 0.29 | -0.27 | -1.23 | |
| 3 | 0 | 0 | -0.9 | -1.26 | Hochpunkt H(3|0) |
| 3.5 | -0.1378 | -0.6 | -1.47 | -0.99 | |
| 4 | -0.64 | -1.44 | -1.84 | -0.42 | |
| 4.5 | -1.5947 | -2.38 | -1.84 | 0.45 | |
| 5 | -3 | -3.2 | -1.34 | 1.62 | |
| 5.5 | -4.7266 | -3.61 | -0.17 | 3.09 | |
| 5.554 | -4.9216 | -3.61 | 0 | 3.27 | Wendepunkt W(5.55|-4.92) |
| 6 | -6.48 | -3.24 | 1.8 | 4.86 | |
| 6.5 | -7.7634 | -1.65 | 4.74 | 6.93 | |
| 6.784 | -8.0132 | 0 | 6.89 | 8.24 | Tiefpunkt T(6.78|-8.01) |
| 7 | -7.84 | 1.68 | 8.78 | 9.31 | |
| 7.5 | -5.6953 | 7.34 | 14.09 | 11.98 | |
| 8 | 0 | 16 | 20.8 | 14.95 | Nullstelle N(8|0) |
| 8.5 | 10.9278 | 28.4 | 29.08 | 18.22 | |
| 9 | 29.16 | 45.36 | 39.06 | 21.79 | |
| 9.5 | 57.1959 | 67.77 | 50.91 | 25.66 | |
| 10 | 98 | 96.6 | 64.76 | 29.83 | |
| Graph: | |||||
 | |||||
Abkürzungen: Df = (maximaler) Definitionsbereich, f(x) = Funktion, f'(x) = 1. Ableitung, f''(x) = 2. Ableitung, f'''(x) = 3. Ableitung, H = Hochpunkt, N = Nullstelle, P = Polstelle, R = reelle Zahlen, T = Tiefpunkt, W = Wendepunkt, WS = Sattelpunkt, Wf = Wertebereich, {.} = ein-/mehrelementige Menge, [.; .] = abgeschlossenes Intervall, (.; .) = offenes Intervall, [.; .), (.; .] = halboffenes Intervall, ∞ = unendlich.
Bearbeiter: Michael Buhlmann