www.michael-buhlmann.de
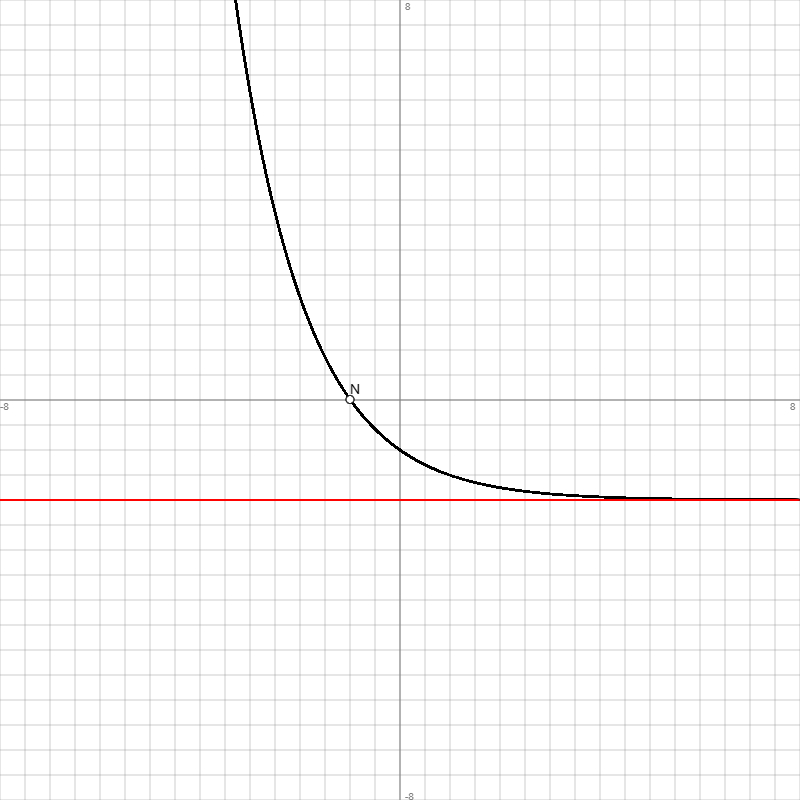
Funktion: f(x) = e-0.7x-2, Df = R, Wf = (-2; +∞), reelle Funktion, x -> -∞: f(x) -> +∞, x -> +∞: f(x) -> -2 = y als Grenzkurve ->
| Wertetabelle: | |||||
| x | f(x) | f'(x) | f''(x) | f'''(x) | Besondere Kurvenpunkte |
| -8 | 268.4264 | -189.3 | 132.51 | -92.43 | |
| -7.5 | 188.5663 | -133.4 | 93.38 | -65.14 | |
| -7 | 132.2898 | -94 | 65.8 | -45.9 | |
| -6.5 | 92.6324 | -66.24 | 46.37 | -32.35 | |
| -6 | 64.6863 | -46.68 | 32.68 | -22.79 | |
| -5.5 | 44.9931 | -32.9 | 23.03 | -16.06 | |
| -5 | 31.1155 | -23.18 | 16.23 | -11.32 | |
| -4.5 | 21.3361 | -16.34 | 11.43 | -7.98 | |
| -4 | 14.4446 | -11.51 | 8.06 | -5.62 | |
| -3.5 | 9.5883 | -8.11 | 5.68 | -3.96 | |
| -3 | 6.1662 | -5.72 | 4 | -2.79 | |
| -2.5 | 3.7546 | -4.03 | 2.82 | -1.97 | |
| -2 | 2.0552 | -2.84 | 1.99 | -1.39 | |
| -1.5 | 0.8577 | -2 | 1.4 | -0.98 | |
| -1 | 0 | -1.41 | 0.99 | -0.69 | Nullstelle N(-1|0) |
| -0.5 | -0.5809 | -0.99 | 0.7 | -0.49 | |
| 0 | -1 | -0.7 | 0.49 | -0.34 | Schnittpunkt Sy(0|-1) |
| 0.5 | -1.2953 | -0.49 | 0.35 | -0.24 | |
| 1 | -1.5034 | -0.35 | 0.24 | -0.17 | |
| 1.5 | -1.6501 | -0.24 | 0.17 | -0.12 | |
| 2 | -1.7534 | -0.17 | 0.12 | -0.08 | |
| 2.5 | -1.8262 | -0.12 | 0.09 | -0.06 | |
| 3 | -1.8775 | -0.09 | 0.06 | -0.04 | |
| 3.5 | -1.9137 | -0.06 | 0.04 | -0.03 | |
| 4 | -1.9392 | -0.04 | 0.03 | -0.02 | |
| 4.5 | -1.9571 | -0.03 | 0.02 | -0.01 | |
| 5 | -1.9698 | -0.02 | 0.01 | -0.01 | |
| 5.5 | -1.9787 | -0.01 | 0.01 | -0.01 | |
| 6 | -1.985 | -0.01 | 0.01 | -0.01 | |
| 6.5 | -1.9894 | -0.01 | 0.01 | 0 | |
| 7 | -1.9926 | -0.01 | 0 | 0 | |
| 7.5 | -1.9948 | 0 | 0 | 0 | |
| 8 | -1.9963 | 0 | 0 | 0 | |
| Graph: | |||||
 | |||||
Graph(en) der Asymptote(n), Grenzkurve(n).
Abkürzungen: Df = (maximaler) Definitionsbereich, f(x) = Funktion, f'(x) = 1. Ableitung, f''(x) = 2. Ableitung, f'''(x) = 3. Ableitung, H = Hochpunkt, L = Lücke, N = Nullstelle, P = Polstelle, R = reelle Zahlen, S = Sprungstelle, T = Tiefpunkt, W = Wendepunkt, WS = Sattelpunkt, Wf = Wertebereich, {.} = ein-/mehrelementige Menge, [.; .] = abgeschlossenes Intervall, (.; .) = offenes Intervall, [.; .), (.; .] = halboffenes Intervall, ∞ = unendlich.
Bearbeiter: Michael Buhlmann