www.michael-buhlmann.de
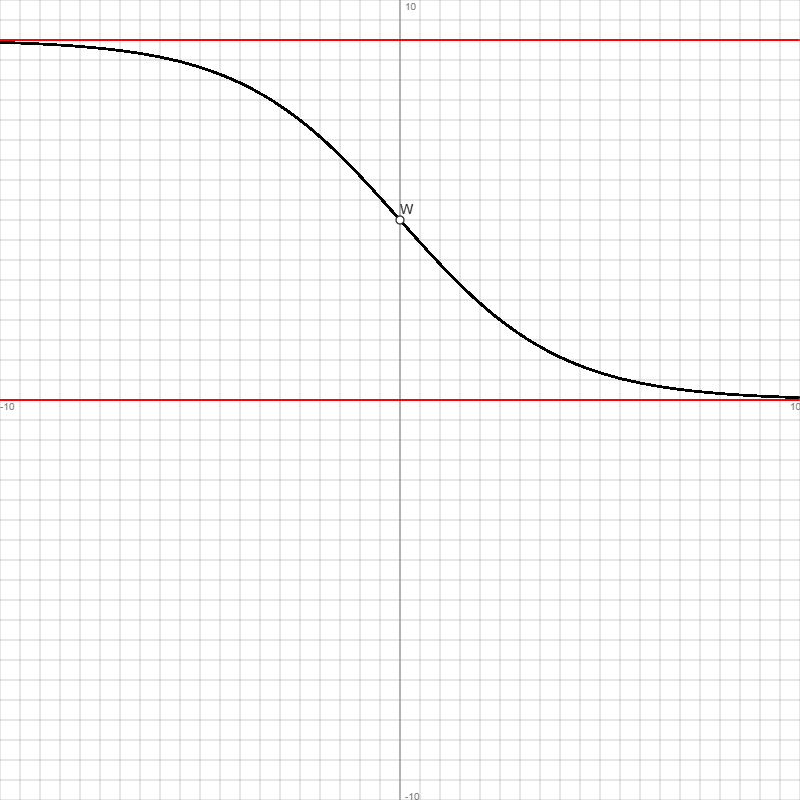
Funktion: f(x) = 9/(1+ex/2), Df = R, Wf = (0; 9), reelle Funktion, x -> -∞: f(x) -> 9 = y als Grenzkurve, x -> +∞: f(x) -> 0 = y als Grenzkurve ->
| Wertetabelle: | |||||
| x | f(x) | f'(x) | f''(x) | f'''(x) | Besondere Kurvenpunkte |
| -10 | 8.9398 | -0.03 | -0.01 | -0.01 | |
| -9.5 | 8.9228 | -0.04 | -0.02 | -0.01 | |
| -9 | 8.9011 | -0.05 | -0.02 | -0.01 | |
| -8.5 | 8.8734 | -0.06 | -0.03 | -0.01 | |
| -8 | 8.8381 | -0.08 | -0.04 | -0.02 | |
| -7.5 | 8.7932 | -0.1 | -0.05 | -0.02 | |
| -7 | 8.7362 | -0.13 | -0.06 | -0.03 | |
| -6.5 | 8.6641 | -0.16 | -0.07 | -0.03 | |
| -6 | 8.5732 | -0.2 | -0.09 | -0.04 | |
| -5.5 | 8.4592 | -0.25 | -0.11 | -0.04 | |
| -5 | 8.3173 | -0.32 | -0.13 | -0.05 | |
| -4.5 | 8.1419 | -0.39 | -0.16 | -0.05 | |
| -4 | 7.9272 | -0.47 | -0.18 | -0.04 | |
| -3.5 | 7.6676 | -0.57 | -0.2 | -0.03 | |
| -3 | 7.3582 | -0.67 | -0.21 | -0.02 | |
| -2.5 | 6.9957 | -0.78 | -0.22 | 0.01 | |
| -2 | 6.5795 | -0.88 | -0.2 | 0.04 | |
| -1.5 | 6.1126 | -0.98 | -0.18 | 0.08 | |
| -1 | 5.6021 | -1.06 | -0.13 | 0.11 | |
| -0.5 | 5.0596 | -1.11 | -0.07 | 0.13 | |
| 0 | 4.5 | -1.12 | 0 | 0.14 | Schnittpunkt Sy(0|4.5) = Wendepunkt W(0|4.5) |
| 0.5 | 3.9404 | -1.11 | 0.07 | 0.13 | |
| 1 | 3.3979 | -1.06 | 0.13 | 0.11 | |
| 1.5 | 2.8874 | -0.98 | 0.18 | 0.07 | |
| 2 | 2.4205 | -0.88 | 0.2 | 0.04 | |
| 2.5 | 2.0043 | -0.78 | 0.22 | 0.01 | |
| 3 | 1.6418 | -0.67 | 0.21 | -0.02 | |
| 3.5 | 1.3324 | -0.57 | 0.2 | -0.03 | |
| 4 | 1.0728 | -0.47 | 0.18 | -0.04 | |
| 4.5 | 0.8581 | -0.39 | 0.16 | -0.05 | |
| 5 | 0.6827 | -0.32 | 0.13 | -0.05 | |
| 5.5 | 0.5408 | -0.25 | 0.11 | -0.04 | |
| 6 | 0.4268 | -0.2 | 0.09 | -0.04 | |
| 6.5 | 0.3359 | -0.16 | 0.07 | -0.03 | |
| 7 | 0.2638 | -0.13 | 0.06 | -0.03 | |
| 7.5 | 0.2068 | -0.1 | 0.05 | -0.02 | |
| 8 | 0.1619 | -0.08 | 0.04 | -0.02 | |
| 8.5 | 0.1266 | -0.06 | 0.03 | -0.01 | |
| 9 | 0.0989 | -0.05 | 0.02 | -0.01 | |
| 9.5 | 0.0772 | -0.04 | 0.02 | -0.01 | |
| 10 | 0.0602 | -0.03 | 0.01 | -0.01 | |
| Graph: | |||||
 | |||||
Graph(en) der Asymptote(n), Grenzkurve(n).
Abkürzungen: Df = (maximaler) Definitionsbereich, f(x) = Funktion, f'(x) = 1. Ableitung, f''(x) = 2. Ableitung, f'''(x) = 3. Ableitung, H = Hochpunkt, L = Lücke, N = Nullstelle, P = Polstelle, R = reelle Zahlen, S = Sprungstelle, T = Tiefpunkt, W = Wendepunkt, WS = Sattelpunkt, Wf = Wertebereich, {.} = ein-/mehrelementige Menge, [.; .] = abgeschlossenes Intervall, (.; .) = offenes Intervall, [.; .), (.; .] = halboffenes Intervall, ∞ = unendlich.
Bearbeiter: Michael Buhlmann