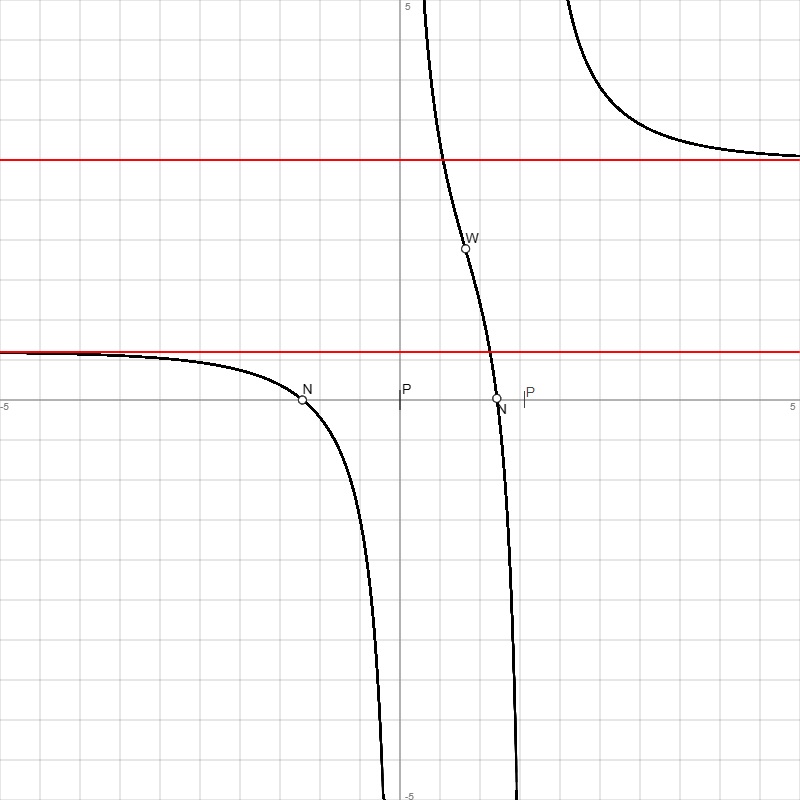
 , Df = R, Wf = R, reelle Funktion, x -> -∞: f(x) -> 3/5 = y als Grenzkurve, x -> +∞: f(x) -> 3 = y als Grenzkurve ->
www.michael-buhlmann.de
Funktion: f(x) =  , Df = R, Wf = R, reelle Funktion, x -> -∞: f(x) -> 3/5 = y als Grenzkurve, x -> +∞: f(x) -> 3 = y als Grenzkurve ->
| Wertetabelle: | |||||
| x | f(x) | f'(x) | f''(x) | f'''(x) | Besondere Kurvenpunkte |
| -5 | 0.59 | -0.01 | -0.01 | -0.01 | |
| -4.5 | 0.5834 | -0.02 | -0.02 | -0.02 | |
| -4 | 0.5725 | -0.03 | -0.03 | -0.03 | |
| -3.5 | 0.5541 | -0.05 | -0.05 | -0.06 | |
| -3 | 0.5229 | -0.08 | -0.09 | -0.1 | |
| -2.5 | 0.469 | -0.14 | -0.16 | -0.21 | |
| -2 | 0.3724 | -0.26 | -0.33 | -0.51 | |
| -1.5 | 0.1873 | -0.52 | -0.79 | -1.57 | |
| -1.215 | 0 | -0.83 | -1.47 | -3.57 | Nullstelle N(-1.22|0) |
| -1 | -0.2188 | -1.25 | -2.6 | -7.7 | |
| -0.5 | -1.4856 | -5.08 | -20.23 | -121.58 | |
| 0 | Infinity | Infinity | Infinity | Infinity | Senkrechte Asymptote/Pol x = 0 mit Vorzeichenwechsel: x -> 0-: f(x) -> -∞, x -> 0+: f(x) -> +∞ |
| 0.5 | 3.2111 | -5.74 | 18.32 | -123.41 | |
| 0.815 | 1.8948 | -3.51 | 0.03 | -34.35 | Wendepunkt W(0.82|1.89) |
| 1 | 1.2074 | -4.15 | -7.67 | -57.91 | |
| 1.2125 | 0 | -7.96 | -35.38 | -284.97 | Nullstelle N(1.21|0) |
| 1.5 | -7.7347 | -96.44 | -1754.97 | -50434.42 | |
| 1.605 | -256.392 | -85533.53 | -38546605.33 | 205732744798.12 | Hochpunkt H(1.61|-256.39) = Wendepunkt W(1.61|-256.39) |
| 1.61 | 2048.6819 | 193796.28 | -689560065.38 | 371925140223.33 | Hochpunkt H(1.61|2048.68) = Wendepunkt W(1.61|2048.68) |
| 2 | 5.6025 | -7.67 | 38.9 | -293.29 | |
| 2.5 | 3.9123 | -1.48 | 3.39 | -11.11 | |
| 3 | 3.4467 | -0.58 | 0.92 | -1.94 | |
| 3.5 | 3.2434 | -0.28 | 0.37 | -0.59 | |
| 4 | 3.1393 | -0.15 | 0.18 | -0.24 | |
| 4.5 | 3.0817 | -0.09 | 0.09 | -0.11 | |
| 5 | 3.0486 | -0.05 | 0.05 | -0.06 | |
| Graph: | |||||
 | |||||
Graph(en) der Asymptote(n), Grenzkurve(n).
Abkürzungen: Df = (maximaler) Definitionsbereich, f(x) = Funktion, f'(x) = 1. Ableitung, f''(x) = 2. Ableitung, f'''(x) = 3. Ableitung, H = Hochpunkt, L = Lücke, N = Nullstelle, P = Polstelle, R = reelle Zahlen, S = Sprungstelle, T = Tiefpunkt, W = Wendepunkt, WS = Sattelpunkt, Wf = Wertebereich, {.} = ein-/mehrelementige Menge, [.; .] = abgeschlossenes Intervall, (.; .) = offenes Intervall, [.; .), (.; .] = halboffenes Intervall, ∞ = unendlich.
Bearbeiter: Michael Buhlmann